If you've opened Activity Monitor on your Mac and seen the Memory Pressure graph glowing red, you already know something is wrong — apps stutter, windows take seconds to redraw, and the spinning beach ball shows up even when you're just switching tabs. Red memory pressure means macOS has run out of comfortable headroom in RAM and is leaning hard on swap (virtual memory written to your SSD) to keep everything running. In 2026, with macOS Tahoe pushing heavier background indexing and more Apple Intelligence processes running by default, this issue has become far more common, even on machines with 16GB or 24GB of RAM.
This guide explains exactly what memory pressure means, why it turns red, and walks through real fixes — from quick Activity Monitor checks to Terminal commands that reveal what's actually eating your RAM.
What Causes Red Memory Pressure on a Mac
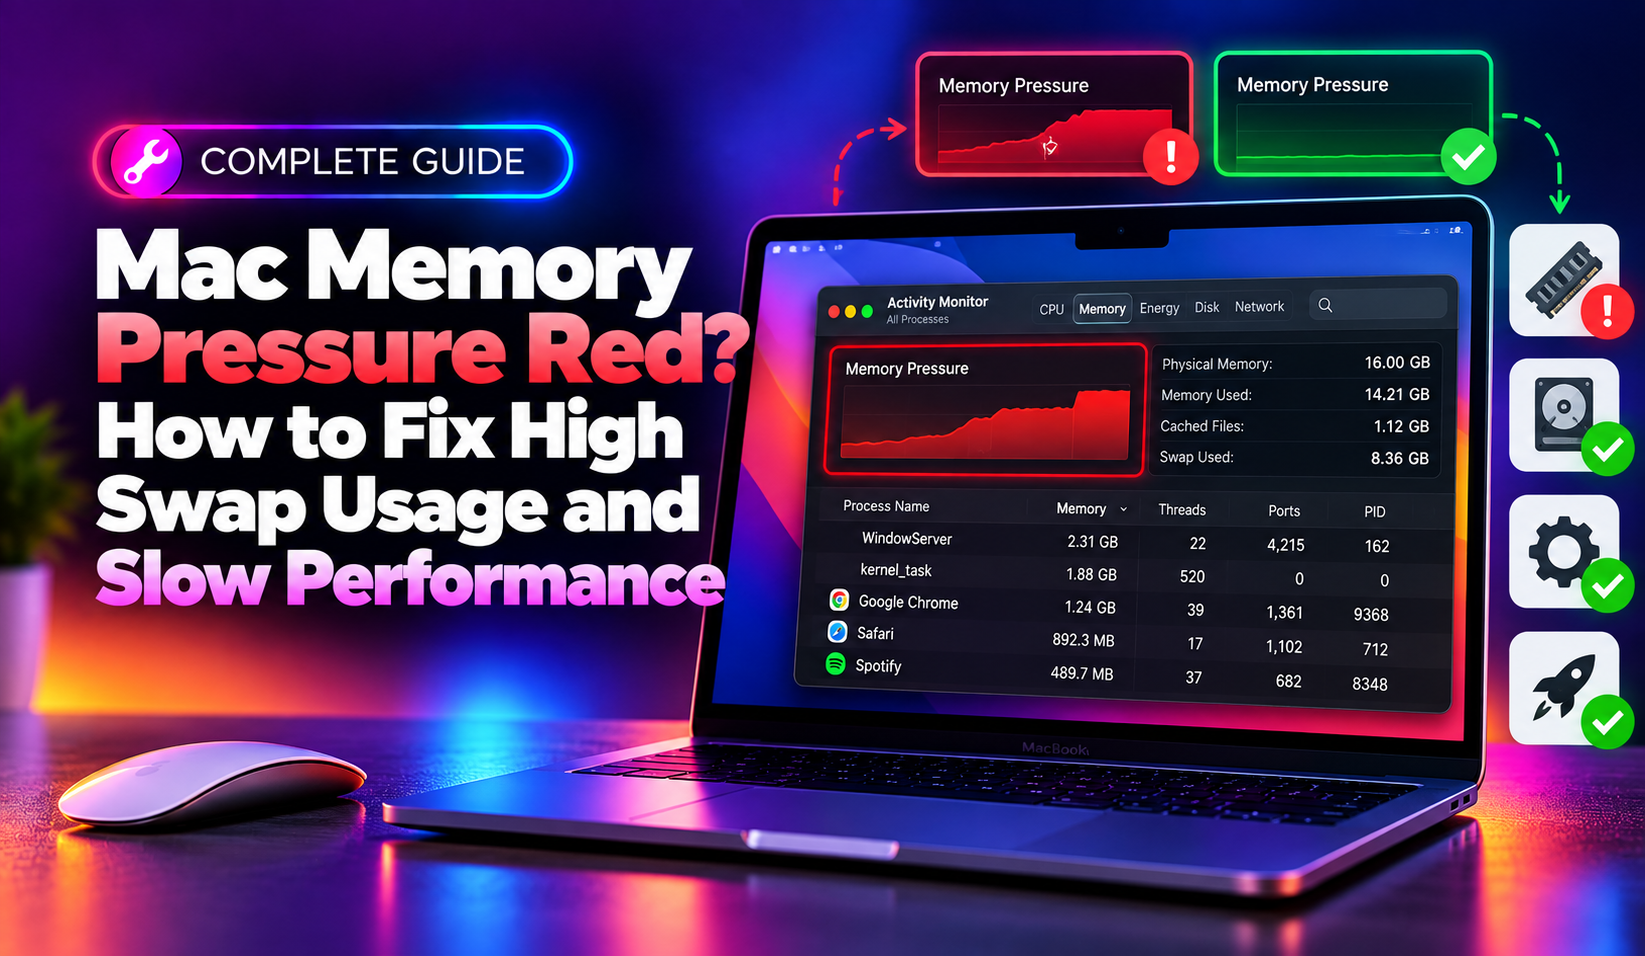
Memory pressure is Apple's way of describing how hard your Mac is working to manage available memory. Green means plenty of free RAM. Yellow means macOS is starting to compress inactive memory. Red means your Mac is swapping actively — writing chunks of memory to disk and reading them back constantly, which is dramatically slower than RAM and is the direct cause of lag and beach balls.
- Too many apps and browser tabs open at once — each Chrome or Safari tab can consume 200-500MB, and dozens of tabs add up fast.
- Memory leaks in long-running apps — some apps (especially Electron-based apps like Slack, Discord, or VS Code) slowly accumulate memory over days of uptime without releasing it.
- Insufficient free disk space — macOS uses free SSD space as swap overflow. When your drive is nearly full, swap itself slows down, making memory pressure worse even if RAM usage looks normal.
- Background indexing and sync processes — Spotlight (mds_stores), Photos analysis (photoanalysisd), iCloud sync, and Time Machine local snapshots all compete for memory during their run cycles.
- Long uptime without a restart — the longer macOS runs without rebooting, the more memory gets fragmented and held by processes that never release it cleanly.
- Insufficient physical RAM for your workload — if you regularly run video editing, virtual machines, or many Chrome tabs on an 8GB or 16GB Mac, red memory pressure may simply reflect a real hardware limit.
Method 1: Diagnose What's Using Your Memory
Before applying any fix, identify the actual cause. Open Activity Monitor (Cmd+Space, type "Activity Monitor") and click the Memory tab. Look at the Memory Pressure graph at the bottom — if it's solidly red rather than a brief spike, you have a real problem.
- Sort the process list by the Memory column to see which apps use the most RAM.
- Check the Swap Used figure at the bottom of the window. Anything consistently above 2-3GB indicates chronic memory exhaustion, not a temporary blip.
- Look at Cached Files vs App Memory — high cached files is normal and gets released automatically when needed, so don't panic if App Memory looks lower than total usage.
For a deeper Terminal-based view, run:
vm_stat— shows pages free, active, inactive, and swapped, refreshed in real time.sysctl vm.swapusage— shows total swap allocated and currently in use, e.g. total = 2048.00M used = 1523.45M free = 524.55M.top -o mem— lists running processes sorted by memory footprint directly in Terminal.
Method 2: Quit and Restart Memory-Hungry Apps
The fastest fix for a red memory pressure spike is reclaiming memory from apps that are hoarding it.
- In Activity Monitor, select the top memory consumer and click the X button, then choose Quit (not Force Quit unless it's unresponsive).
- Fully quit browsers with Cmd+Q rather than just closing windows — Chrome and Safari keep background helper processes alive otherwise.
- If a specific app (commonly Chrome, Slack, Discord, or Photos) keeps climbing in memory usage over hours without dropping, that's a memory leak — quit and relaunch it periodically, and check for a pending update.
- Disable unnecessary browser extensions, which often run persistent background scripts that consume RAM even when idle.
If quitting apps doesn't bring the pressure graph back to green within a minute or two, restart your Mac. A restart clears all swap files and fully resets any process holding memory it shouldn't — if pressure returns to red again quickly after a fresh boot, that points to a specific app or background process rather than general RAM exhaustion.
Method 3: Free Up Disk Space and Reduce Background Load
Since macOS uses free SSD space for swap overflow, a nearly-full drive makes memory pressure noticeably worse.
- Open Apple menu > About This Mac > Storage > Manage to see a breakdown and clear out old iOS backups, unused apps, and large files.
- Keep at least 10-15% of your total storage free — Macs with less than 10% free space show measurably higher CPU and swap activity purely from virtual memory management overhead.
- Empty the Trash and check Downloads and Desktop for large forgotten files (video exports, disk images, old installers).
- Reduce login items under System Settings > General > Login Items & Extensions — fewer apps launching at boot means more RAM available from the moment you log in.
- If Spotlight indexing (
mds_stores) or Photos analysis (photoanalysisd) is consuming significant memory in Activity Monitor, let it finish rather than force-quitting repeatedly; interrupting it can force it to restart the index from scratch.
For businesses managing multiple Macs where this becomes a recurring support issue, CloudHouse Technologies offers on-demand desktop troubleshooting support that can diagnose recurring memory and performance problems without a full managed IT contract.
Method 4: Reset SMC and Check for Software Updates
Occasionally, red memory pressure that appears suddenly after a macOS update or sleep/wake cycle is tied to a system-level bug rather than genuine RAM exhaustion.
- Check System Settings > General > Software Update for a pending Tahoe point release — Apple has shipped several memory-management fixes in incremental Tahoe updates throughout 2026.
- On Apple Silicon Macs, shut down completely, wait 10 seconds, and boot back up — this resets low-level memory management state that a normal restart doesn't always clear.
- Check Console.app for repeated
jetsamormemorystatuslog entries, which indicate macOS is actively killing background processes to reclaim memory — a strong signal of genuine RAM shortage rather than a display glitch.
Prevention Tips
- Restart your Mac at least once a week to clear accumulated swap and fragmented memory.
- Keep Chrome/Safari tab counts manageable, or use tab-suspending extensions that free memory from inactive tabs.
- Monitor swap usage periodically with
sysctl vm.swapusageso you catch a creeping leak before it becomes a daily slowdown. - Keep at least 15% of your SSD free at all times.
- If you consistently see 2-3GB+ of swap used during normal daily work, treat it as a signal that your Mac's RAM is undersized for your workload, and plan for a hardware upgrade or a machine with more memory.
Frequently Asked Questions
What does red memory pressure actually mean on a Mac?
It means macOS is heavily swapping — writing and reading memory pages to and from disk because physical RAM is full. This is dramatically slower than RAM access and causes the lag, stutter, and beach balls you notice.
Is swap usage always bad?
No. Some swap use is normal and expected even with plenty of free RAM, since macOS proactively manages memory. The concern is chronic swap usage of several gigabytes alongside a red pressure graph, which indicates real memory exhaustion.
Will more RAM fix memory pressure permanently?
If your workload (video editing, many browser tabs, virtual machines) genuinely exceeds your installed RAM, then yes — more RAM is the only lasting fix. But if pressure spikes are caused by a leaking app or a nearly-full drive, those are fixable without new hardware.
Does closing browser tabs actually help memory pressure?
Yes, significantly. Each tab can hold 200-500MB depending on the site, and browsers rarely release that memory until the tab or the whole browser is closed, so quitting unused tabs is one of the fastest ways to reduce pressure.
How do I check swap usage from Terminal?
Run sysctl vm.swapusage to see total, used, and free swap space, or use vm_stat for a more detailed live breakdown of memory pages.