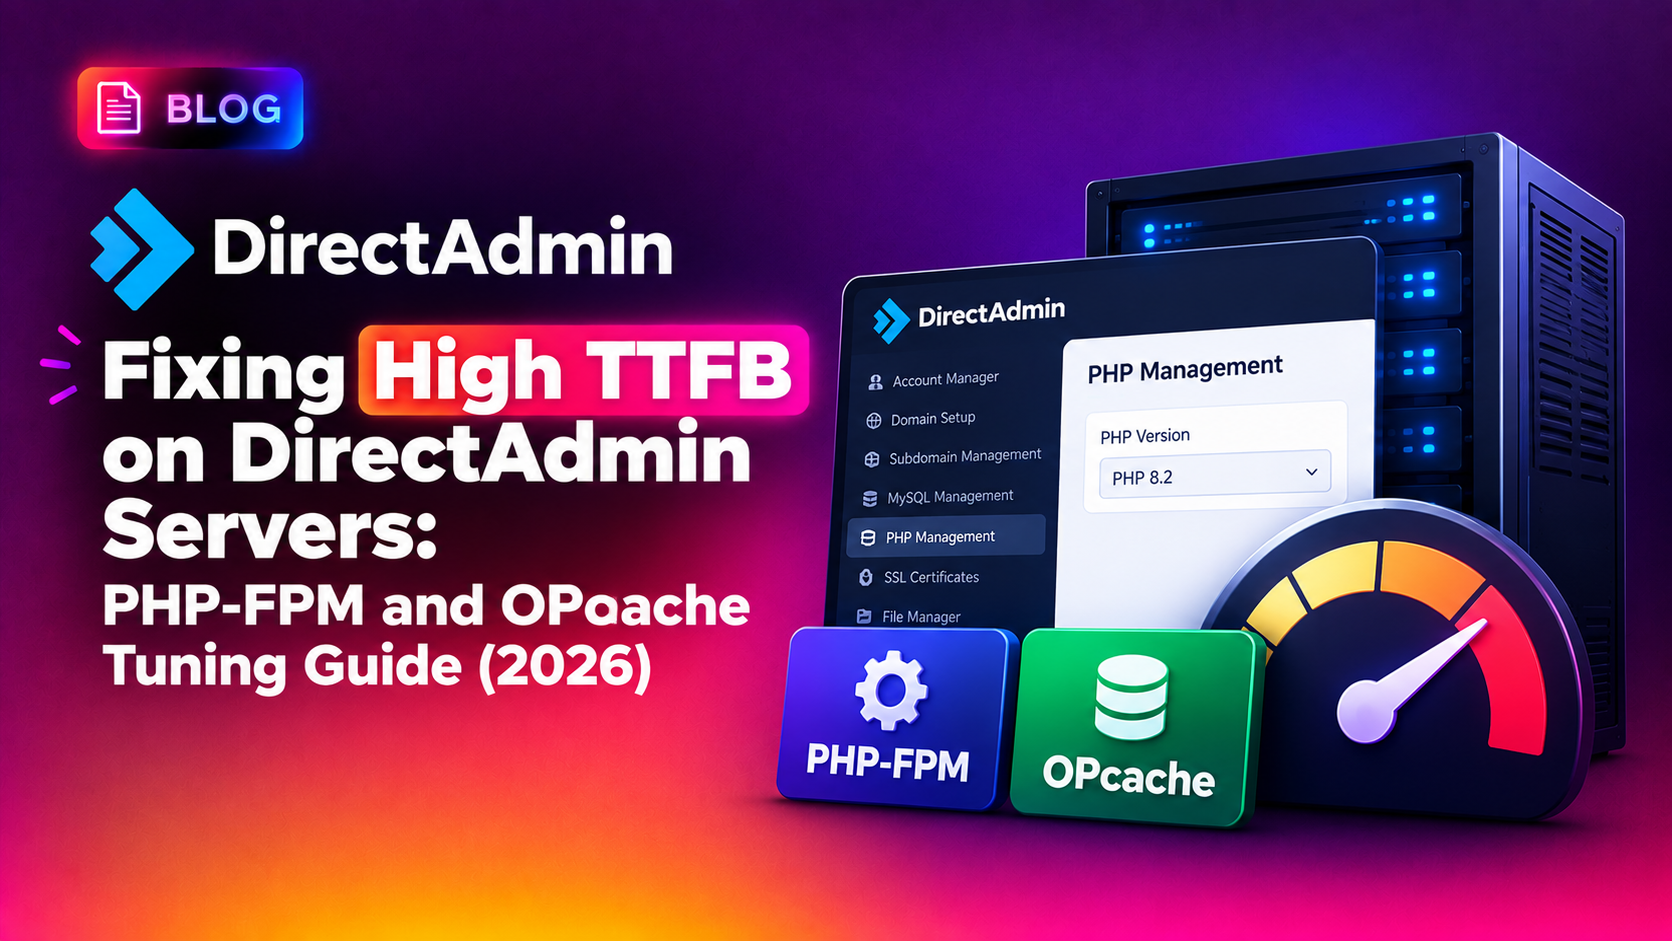
A slow Time to First Byte (TTFB) on a DirectAdmin server almost always points to the same handful of culprits: an unconfigured OPcache, PHP-FPM running in the wrong process manager mode, or a database query pattern that's quietly eating CPU on every page load. This guide walks through diagnosing which layer is actually responsible and applying the specific PHP-FPM and OPcache settings that consistently bring TTFB down on real-world DirectAdmin installs.
What TTFB Is Actually Measuring
TTFB is the time between the browser sending a request and receiving the first byte of the response — it captures DNS lookup, connection setup, server processing, and the time your application takes to generate the page before any HTML is sent. A high TTFB (anything consistently above 400-600ms for a dynamic page) means the server-side processing chain is the bottleneck, not the network or the browser rendering the page.
On DirectAdmin servers running Apache with PHP-FPM (the standard modern configuration via CustomBuild), TTFB problems trace back almost exclusively to PHP execution time rather than Apache itself, since Apache's job in this setup is just to proxy the request to PHP-FPM and wait.
Step 1: Confirm Where the Time Is Actually Going
Before changing any configuration, measure. Use curl's timing breakdown against the affected site:
curl -w "@curl-format.txt" -o /dev/null -s https://example.com/With a curl-format.txt containing timing fields like time_starttransfer, you can see exactly how much of the total request time happens before the first byte arrives versus during content transfer. If time_starttransfer is the dominant number, the bottleneck is confirmed server-side.
💡 None of these worked? Skip the guesswork.
Get Expert Help →Step 2: Check PHP-FPM's Process Manager Mode
DirectAdmin's default CustomBuild install often configures PHP-FPM in ondemand mode, which spins up a fresh PHP-FPM worker process on each new request after an idle period, adding measurable latency to the very first request after idle time. For any production site with regular traffic, dynamic mode keeps a pool of warm workers ready and avoids this cold-start penalty.
1. Locate the pool configuration.
DirectAdmin stores PHP-FPM settings in two places, and the user-specific file overrides the global one:
cat /usr/local/directadmin/data/users/username/php/php-fpm74.conf
cat /usr/local/directadmin/custombuild/custom/php-fpm/74/pool.conf2. Switch to dynamic mode with sane worker limits.
pm = dynamic
pm.max_children = 20
pm.start_servers = 5
pm.min_spare_servers = 5
pm.max_spare_servers = 10
pm.max_requests = 500
Size these numbers to your available RAM — each PHP-FPM worker typically consumes 30-80MB depending on the application, so pm.max_children should be calculated against total available memory rather than picked arbitrarily.
3. Rebuild and restart PHP-FPM through CustomBuild.
/usr/local/directadmin/custombuild/build php n
systemctl restart php-fpm74
Step 3: Enable and Tune OPcache
OPcache caches compiled PHP bytecode in memory, eliminating the need to re-parse and re-compile PHP files on every single request. On many DirectAdmin installs OPcache is present but either disabled or running with default settings far too small for a real WordPress or Laravel application.
opcache.enable=1
opcache.memory_consumption=512
opcache.max_accelerated_files=16000
opcache.revalidate_freq=60
opcache.validate_timestamps=1
opcache.interned_strings_buffer=16
For most WordPress installations, 512MB of OPcache memory and 16,000 max accelerated files comfortably covers the plugin and theme file count without hitting cache eviction under normal operation. If a site has an unusually large codebase, check the OPcache status page to confirm the cache isn't being evicted and refilled constantly, which defeats the purpose entirely:
php -i | grep opcacheA Note on revalidate_freq in Production
Setting opcache.revalidate_freq=0 (check file timestamps on every request) is useful during active development but adds unnecessary filesystem overhead on a production server where code changes infrequently. Setting it to 60 means OPcache only re-checks whether cached files have changed once per minute, which is a reasonable balance for most production sites and noticeably reduces per-request overhead.
Step 4: Rule Out Database and Plugin-Level Bottlenecks
If PHP-FPM and OPcache are both correctly tuned and TTFB is still high, the bottleneck has usually moved to the application layer — most commonly a plugin or theme issuing dozens or hundreds of SQL queries per page load. Enable query profiling temporarily to confirm:
mysqldumpslow -s t /var/log/mysql/mysql-slow.logIf a specific plugin or custom code path is generating an excessive number of queries, no amount of PHP-FPM or OPcache tuning will fix it — the query pattern itself needs to be optimized or cached at the application layer (object caching via Redis or Memcached is the standard fix for WordPress sites with heavy query loads).
Step 5: Check for ModSecurity and Bot Traffic Overhead
A less obvious but common contributor: ModSecurity running the full OWASP Core Rule Set against every request adds measurable CPU overhead per request, and this cost compounds under bot traffic. If TTFB spikes correlate with traffic spikes rather than being consistently slow, check for bot-driven load before assuming it's purely a code-level issue:
tail -5000 /var/log/httpd/domains/example.com.log | awk '{print $1}' | sort | uniq -c | sort -rn | head -20A handful of IPs generating a disproportionate share of requests is a strong signal of bot crawling or a scraper hammering the site — rate limiting or challenge rules at the edge (Cloudflare, or Apache's own mod_ratelimit) reduce this load without touching PHP configuration at all.
Step 6: Verify Apache's MPM Settings Aren't the Bottleneck
Even with PHP-FPM handling script execution, Apache's own worker limits (via mpm_event or mpm_worker) can throttle throughput if set too conservatively for the server's traffic level. Check current settings:
apachectl -M | grep mpm
apachectl -S
If MaxRequestWorkers is set low relative to concurrent traffic, requests queue waiting for a free worker before they even reach PHP-FPM, adding to TTFB in a way that looks like a PHP problem but isn't. Increase it in line with available RAM and re-test.
Putting It Together: A Tuning Checklist
- Confirm the bottleneck is server-side using curl timing before touching any config
- Switch PHP-FPM from ondemand to dynamic mode for regularly trafficked sites
- Size pm.max_children against actual available RAM, not a guess
- Enable OPcache with adequate memory_consumption and max_accelerated_files for the codebase size
- Set opcache.revalidate_freq to 60 in production rather than 0
- Profile slow database queries and add object caching if the app is query-heavy
- Check ModSecurity and bot traffic overhead if slowness correlates with traffic spikes
- Verify Apache's MaxRequestWorkers isn't queuing requests before they reach PHP-FPM
Real-World Example
A DirectAdmin-hosted WooCommerce store reported checkout pages consistently taking 1.2 to 1.5 seconds to start rendering, well above the target for a transactional page. PHP-FPM was already running in dynamic mode with reasonable worker counts, ruling out cold-start latency. OPcache was enabled but capped at 128MB with max_accelerated_files at the PHP default of 10,000 — WooCommerce plus a dozen active plugins exceeded that file count, causing the cache to evict and recompile files mid-session. Raising memory_consumption to 512MB and max_accelerated_files to 20,000 eliminated the eviction cycle entirely, and TTFB on checkout pages dropped to roughly 350ms without any application code changes.
This is a common pattern: the OPcache settings that work fine for a simple brochure site quietly become insufficient the moment a store, membership plugin, or page builder adds enough PHP files to blow past the default cache limits.
High TTFB on a DirectAdmin server is rarely one single misconfiguration — it's usually a combination of a conservative PHP-FPM process manager setting, an underpowered or disabled OPcache, and an application layer that hasn't been profiled for slow queries. Working through these layers in order, and measuring after each change, gets to the real bottleneck far faster than guessing. If performance tuning across a fleet of DirectAdmin servers isn't something your team has time to chase down manually, our CloudHouse server management service handles PHP-FPM and OPcache tuning as a standard part of ongoing server optimization.