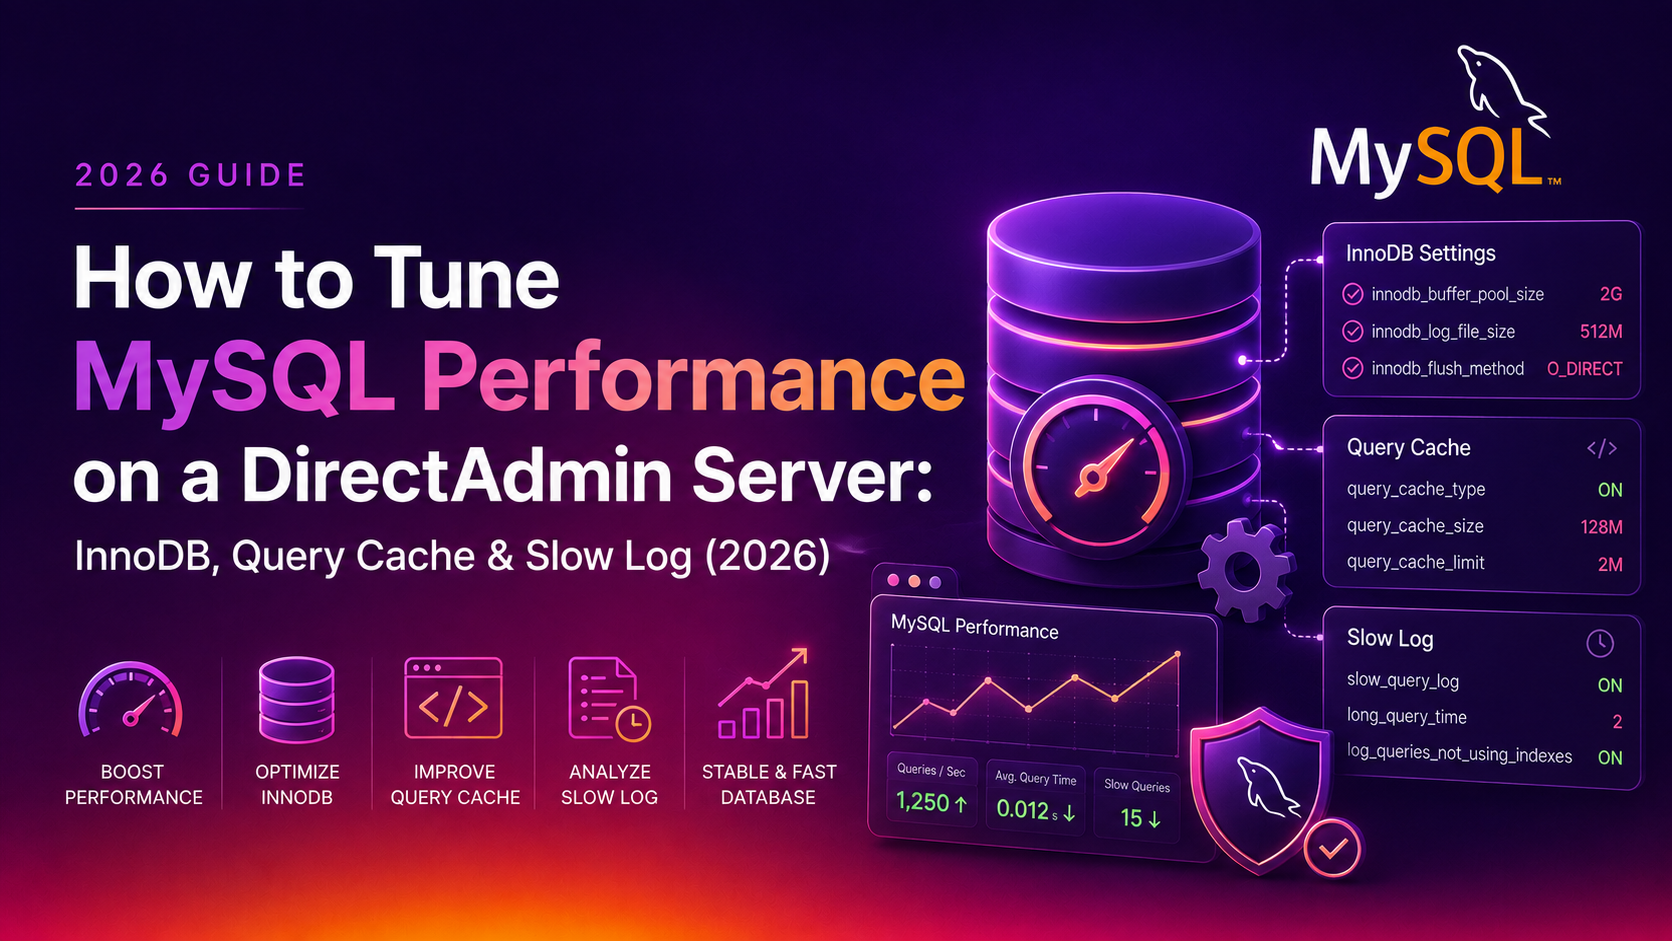
A poorly tuned MySQL installation is the most common cause of slow websites on DirectAdmin servers — more so than PHP, Nginx, or disk I/O. Whether you're seeing high server load during peak hours, slow database queries dragging down WordPress or Magento, or frequent MySQL crashes, the fix almost always comes down to a handful of my.cnf configuration changes. This guide covers MySQL performance tuning for DirectAdmin servers step by step — from profiling the current state to applying and testing the right parameters.
💡 None of these worked? Skip the guesswork.
Get Expert Help →Step 1 — Audit Current MySQL Performance
Before changing any configuration, establish a baseline so you can measure improvement.
mysql -u root -p -e "SELECT VERSION();"
mysql -u root -p -e "SHOW GLOBAL STATUS LIKE 'Uptime';"
mysql -u root -p -e "SHOW GLOBAL STATUS LIKE 'Threads_connected';"mysql -u root -p << 'SQL'
SHOW GLOBAL STATUS LIKE 'Innodb_buffer_pool_read_requests';
SHOW GLOBAL STATUS LIKE 'Innodb_buffer_pool_reads';
SHOW GLOBAL STATUS LIKE 'Key_reads';
SHOW GLOBAL STATUS LIKE 'Key_read_requests';
SHOW GLOBAL STATUS LIKE 'Qcache_hits';
SHOW GLOBAL STATUS LIKE 'Slow_queries';
SQLCalculate your InnoDB buffer pool hit ratio: (1 - Innodb_buffer_pool_reads / Innodb_buffer_pool_read_requests) × 100. A value below 95% means your buffer pool is too small — data is being read from disk instead of RAM.
curl -sL https://raw.githubusercontent.com/major/MySQLTuner-perl/master/mysqltuner.pl | perl
# Let it run for a few minutes — it analyses status variables and outputs recommendations
MySQLTuner provides specific my.cnf values tailored to your current workload. Run it after the server has been up for at least 24 hours for accurate recommendations.
nano /etc/my.cnf
# Add or update in the [mysqld] section:
slow_query_log = 1
slow_query_log_file = /var/log/mysql/slow.log
long_query_time = 1      # log queries taking longer than 1 second
log_queries_not_using_indexes = 1   # also log queries with no index
mkdir -p /var/log/mysql && chown mysql:mysql /var/log/mysql
systemctl restart mysqld# Top 10 slowest queries
mysqldumpslow -s t -t 10 /var/log/mysql/slow.log
# Top 10 most frequently occurring slow queries
mysqldumpslow -s c -t 10 /var/log/mysql/slow.log# Install Percona Toolkit
yum install -y percona-toolkit # AlmaLinux/CentOS
apt install -y percona-toolkit # Ubuntu/Debian
# Analyse slow log
pt-query-digest /var/log/mysql/slow.log | head -100pt-query-digest groups similar queries, shows execution counts, total time consumed, and average query time. This tells you which queries to optimise first.
Step 3 — Tune InnoDB Buffer Pool (Most Important Setting)
The InnoDB buffer pool is MySQL's RAM cache for table data and indexes. Increasing it is the single highest-impact configuration change on most servers.
nano /etc/my.cnf
# Add/update in [mysqld] section:

# Set to 70-80% of total RAM for dedicated MySQL servers
# Set to 30-50% for shared hosting servers
innodb_buffer_pool_size = 2G        # adjust to your server RAM

# For buffer pools > 1GB, split into multiple instances
innodb_buffer_pool_instances = 4    # one per GB recommended

# InnoDB log file size (larger = better write performance, slower crash recovery)
innodb_log_file_size = 256M

# Flush method — O_DIRECT avoids double buffering with OS cache
innodb_flush_method = O_DIRECT

# How often to flush dirty pages (lower = more I/O but safer)
innodb_flush_log_at_trx_commit = 2  # good balance of performance vs durability
RAM allocation guide for DirectAdmin shared hosting servers:
- 4 GB RAM server:
innodb_buffer_pool_size = 1G - 8 GB RAM server:
innodb_buffer_pool_size = 3G - 16 GB RAM server:
innodb_buffer_pool_size = 8G - 32 GB RAM server:
innodb_buffer_pool_size = 18G
Step 4 — Optimise Connection and Thread Settings
# Maximum simultaneous connections (watch Threads_connected in SHOW STATUS)
max_connections = 150

# Thread cache — reuse threads instead of creating/destroying per connection
thread_cache_size = 16

# Table open cache — number of open table file handles kept in memory
table_open_cache = 2000

# Temporary table size — larger reduces disk-based temp tables
tmp_table_size = 64M
max_heap_table_size = 64M

# Sort and join buffer — per-connection memory for sorting and join operations
sort_buffer_size = 2M
join_buffer_size = 2M
read_rnd_buffer_size = 1M
Step 5 — Add Missing Indexes to Slow Queries
After identifying slow queries, the next step is adding indexes. The EXPLAIN statement reveals how MySQL executes a query and whether it's doing a full table scan:
# Analyse a slow query
EXPLAIN SELECT * FROM wp_posts WHERE post_status = 'publish' AND post_type = 'post' ORDER BY post_date DESC;
# Look for: type=ALL (full scan, bad) vs type=ref or range (index used, good)

# Add a composite index for a common WordPress query pattern
ALTER TABLE wp_posts ADD INDEX idx_status_type_date (post_status, post_type, post_date);

# Find tables with no indexes at all
SELECT TABLE_SCHEMA, TABLE_NAME
FROM information_schema.TABLES
WHERE TABLE_SCHEMA NOT IN ('information_schema','performance_schema','mysql','sys')
  AND TABLE_NAME NOT IN (SELECT DISTINCT TABLE_NAME FROM information_schema.STATISTICS);
Step 6 — Apply and Test Changes
# Apply configuration changes
systemctl restart mysqld

# Verify MySQL started successfully
systemctl status mysqld
mysql -u root -p -e "SHOW VARIABLES LIKE 'innodb_buffer_pool_size';"

# Monitor buffer pool hit ratio after 30 minutes of load
mysql -u root -p -e "
SELECT
  ROUND((1 - (Reads/ReadRequests))*100, 2) AS buffer_hit_pct
FROM (
  SELECT
    VARIABLE_VALUE AS Reads FROM performance_schema.global_status WHERE VARIABLE_NAME='Innodb_buffer_pool_reads'
) a, (
  SELECT
    VARIABLE_VALUE AS ReadRequests FROM performance_schema.global_status WHERE VARIABLE_NAME='Innodb_buffer_pool_read_requests'
) b;"
A buffer pool hit rate above 99% means your tuning is working. Below 95% — increase innodb_buffer_pool_size further.
Database performance tuning is an iterative process — initial changes improve things significantly, but sustained optimisation requires ongoing slow query analysis as your application evolves. CloudHouse Technologies provides managed DirectAdmin server support including MySQL performance audits, index optimisation, and proactive slow query monitoring.